Lap times and engine heat on one screen, mounted on your dash.
Nysara OBD reads the engine over OBD-II and the lap over a GPS lap logger at up to 25 Hz, then shows the delta to your best lap next to the temperature that is costing you time.
Desktop app for Windows and macOS
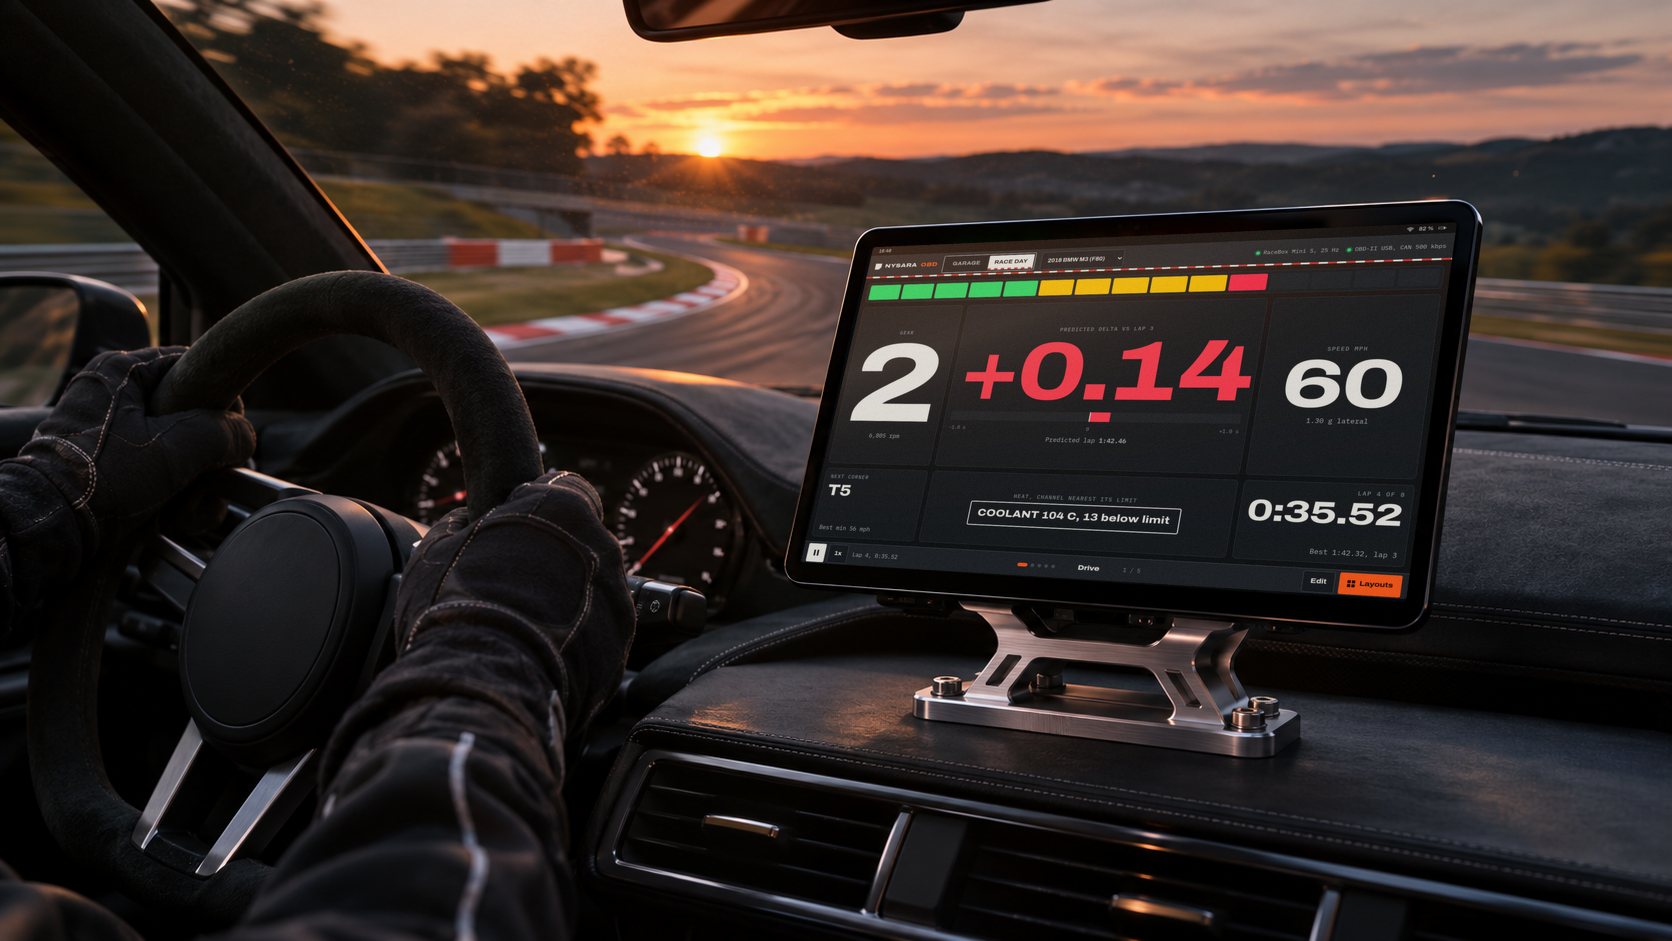
Delta, shift point and engine heat, read in one glance at speed.
The Drive layout puts the predictive delta to your best lap in the center at full height, with gear, speed, shift lights and the next corner's best minimum speed around it. One chip names the temperature closest to its limit.
The Drive layout in the car, full traces in the paddock, both on the same lap cursor.
Know which temperature limit cost you time, and at which corner.
Coolant and intake air temperature on every car; oil, boost and gearbox temperature where the car reports them. The OBD-II readings run on the lap logger's GPS clock and are painted onto the track. Each lap is one band on one scale, so heat soak shows as the bands warming lap over lap, and the lost time is split between heat and driving.
Select a lap to see where its heat cost time on the track.
Each corner gets one input to change, with the time it costs.
For every corner the app finds your best pass of the session and names the input that differed: brake point, minimum speed, throttle pickup or gear. When the inputs match and the lap is still slower, it reports the power lost to heat.
Tire pressures, track temperature and setup, saved with the laps they produced.
Cold pressures go in before the session. Hot pressures are entered after each session, or read from TPMS where the car reports them. Both are stored with ambient and track surface temperature and the alignment sheet in the same session as the lap data, in place of a spreadsheet or a notebook.
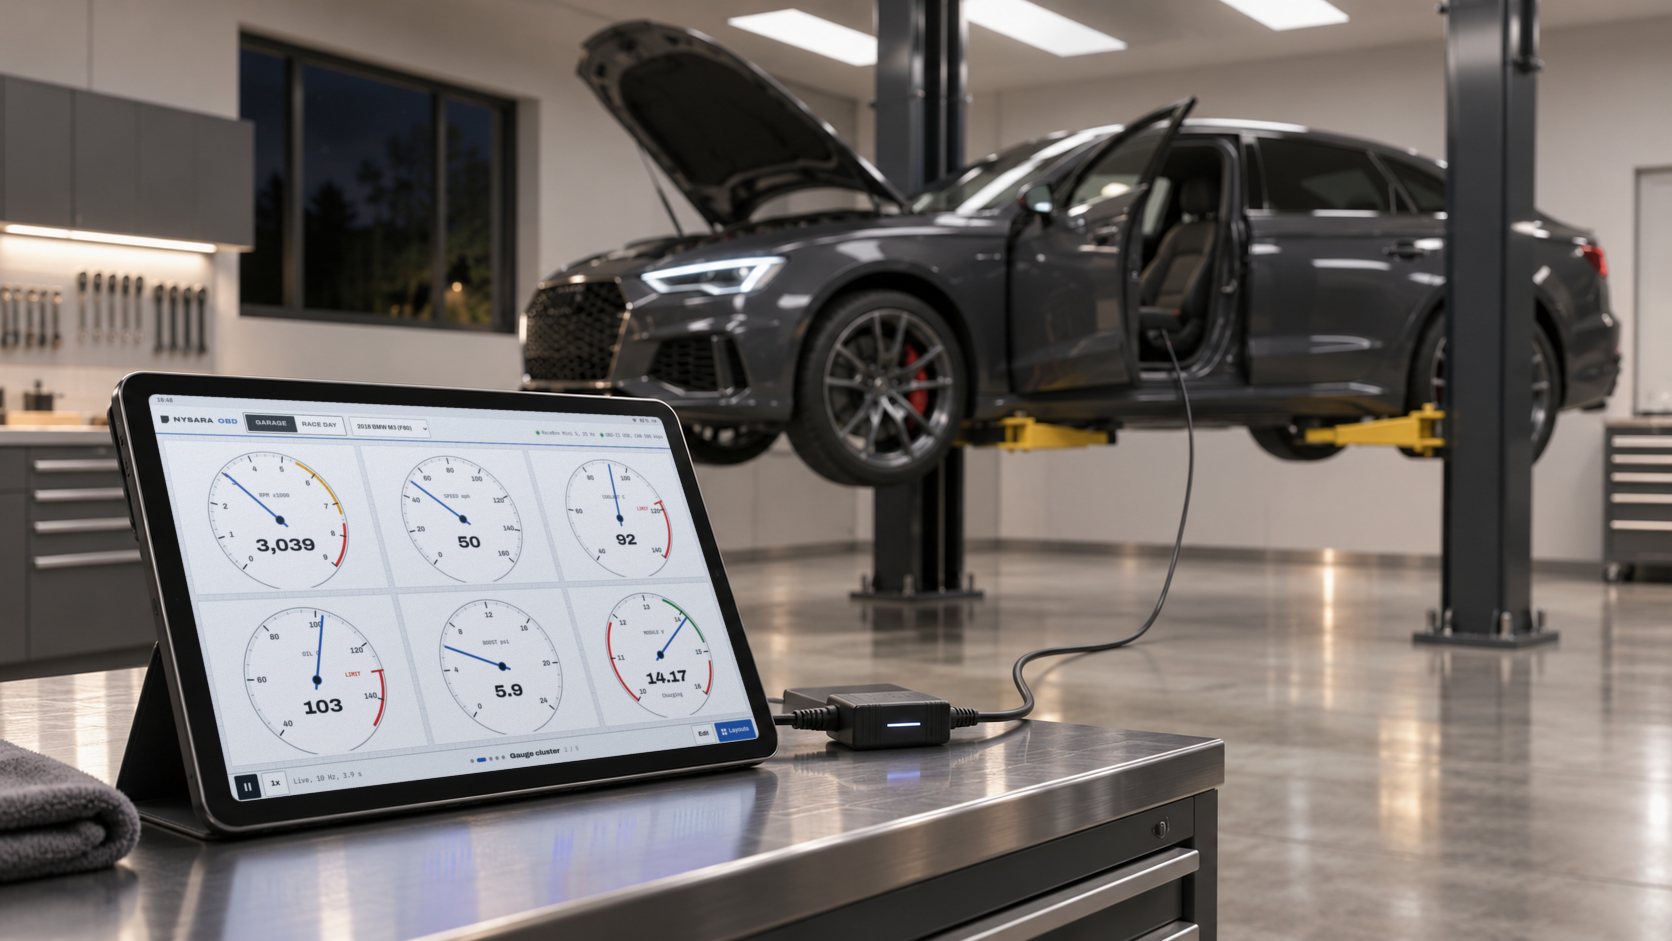
Read and clear trouble codes per module, then ask MechanIQ what they mean.
Garage mode reads the car over the OBD-II USB adapter: analog gauges, live data charts, trouble codes per module, a module explorer, a CAN bus monitor and CSV recording with event marks. MechanIQ, the AI mechanic panel, reads the same live data and explains each code.
One switch at the top left of the app changes every screen. Garage draws the lap as a technical drawing with corner callouts and dimensions, next to codes, gauges and MechanIQ. Race Day draws the same lap on asphalt with curbs, the car's position and its delta to the best lap, colored green where it gains and red where it loses.
- Trouble codesRead and clear per module, with descriptions.
- Live dataAnalog gauges and charts of any supported channel.
- RecordingCSV logs with event marks for later review.
- Steering diagnosticsElectric power steering module checks.
Most makes and models, three lap loggers and one OBD-II USB adapter.
The adapter plugs into the OBD-II port and the computer's USB port. Pick one lap logger in settings; it pairs over Bluetooth Low Energy.
Cars
- Most makes and modelsAny car with an OBD-II port: US model year 1996 and newer, EU petrol 2001 and newer.
- Manufacturer modulesTrouble codes and live data beyond the engine, read per module where the car exposes them.
Lap loggers
- RaceBox Mini / Mini S25 Hz GPS, accelerometer and gyro
- RaceBox Micro25 Hz GPS and IMU, wired power
- Qstarz BL-1000GT10 Hz GPS, NMEA over BLE, no IMU
Engine data
- OBD-II USB adapterReads engine, transmission and module data from the car's OBD-II port.
- Channels on the lapCoolant and intake air temperature on every car; oil, boost and gearbox temperature where the car reports them. RPM and gear are logged alongside.
Open the dash.
The dash opens in this browser with a full session loaded: the Drive and Pits layouts, the heat ribbon and lap stack, corner coaching, trouble codes and MechanIQ.